Google Sheets has a lot of functions meant for analyzing data.
FREQUENCY() is one of them.
FREQUENCY() helps you count how often a given value in an array occurs within another array. It’s a method of comparing one array to another — quickly.
Because it auto-populates columns, it doesn’t take a lot of work to get your data.
At the same time, it also isn’t always the most elegant solution to the problem.
Let’s take a look at the FREQUENCY() function, how it works, when you’d use it, and when you might want to use something else.
Table of Contents
How Does the Google Sheets FREQUENCY Function Work?
The Google Sheets FREQUENCY() function works by comparing two “arrays,” which means two selections of data. The first selection of data is the base set — the data that is being analyzed. The second selection of data is the comparison set.
It’s easiest to understand with an example.
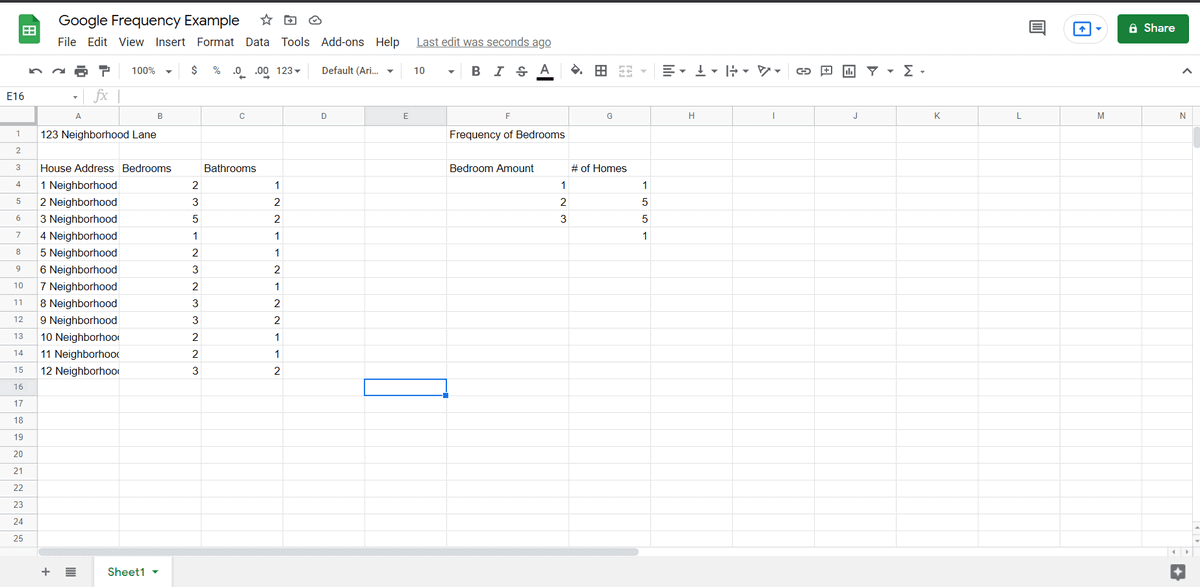
In the above example, we’ve made a list of 12 houses in Neighborhood Lane, along with their bedrooms and their bathrooms.
We want to find the frequency of bedroom sizes.
In one column, we enter in the bedroom amount we are trying to analyze for:
1
2
3
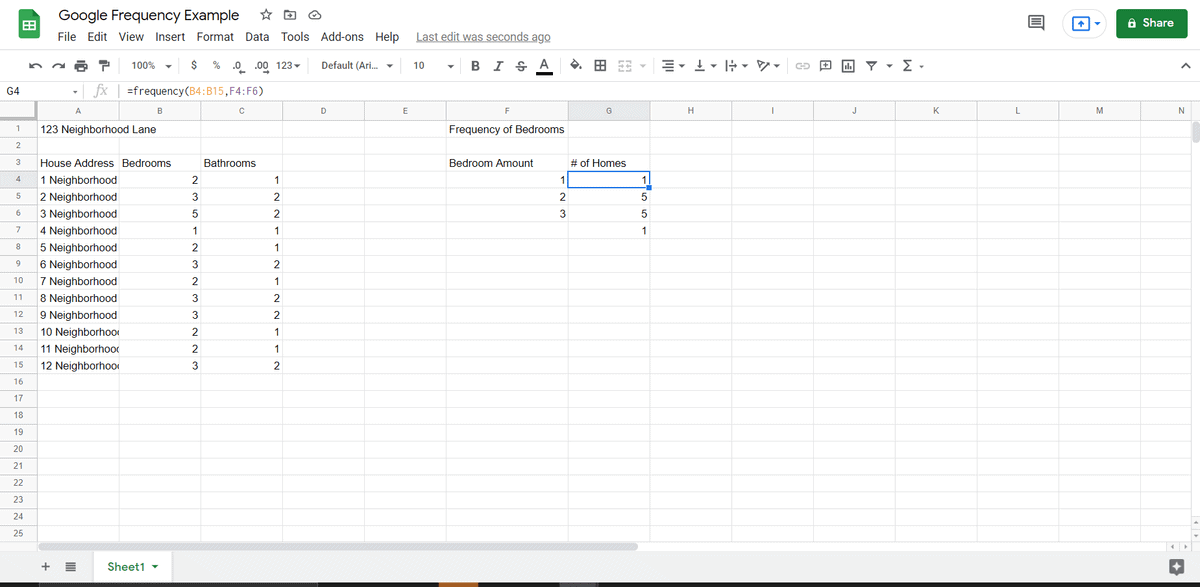
Next to the “1” we enter in our code:
=FREQUENCY(B4:B15,F4:F5);
The first selection selects the entire list of bedroom amounts. The second selection selects the numbers being compared. And the # of Homes column auto populates with:
1
5
5
1
And this is correct. There is 1 one-bedroom house, 5 two-bedroom houses, and 5 three-bedroom houses. The 1 is the number of houses that are outside that range (the sole 5-bedroom house).
When to Use FREQUENCY vs. COUNTIF
When people think about how to find frequency of a function, they’re usually just thinking about getting a “count.” Which leads us to an observation: You can always just use COUNTIF().
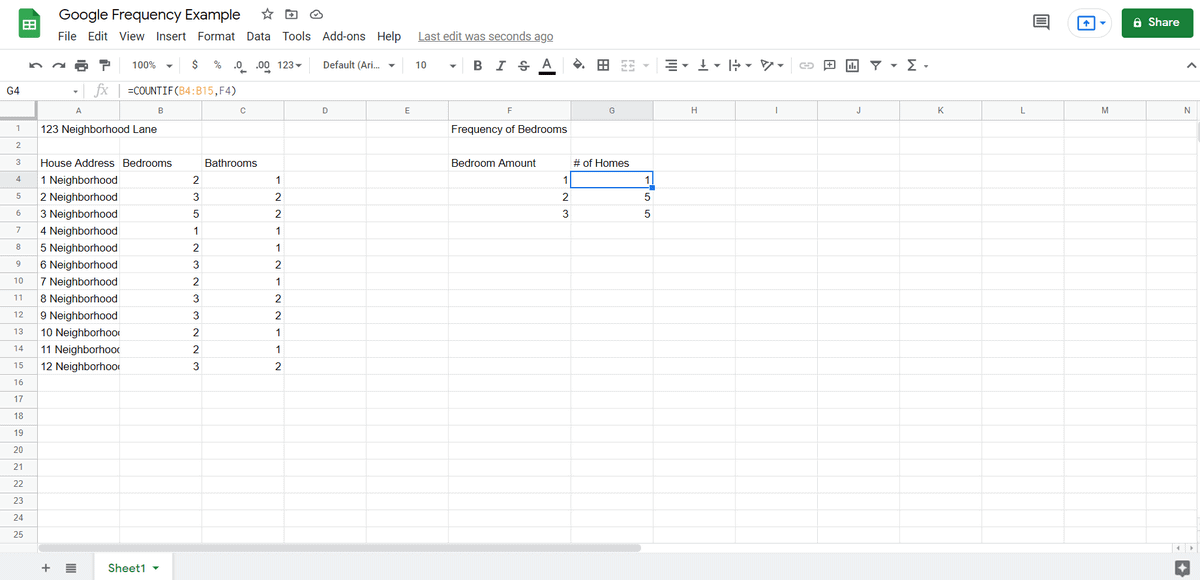
In the above example, you’re instead using:
COUNTIF(B4:B15,F4)
And so forth. It gives you the exact amount. And we could also say something like “>=2” if we wanted a count of all homes that are more than two (or three, or so forth). But it doesn’t populate the entire column and it doesn’t give us a count of things that aren’t one of the included range.
Click here for a full tutorial on how to use the COUNTIF function in Google Sheets.
Using FREQUENCY() for Distribution Chart
What is FREQUENCY() used for? In general, frequency is used for charting. If you select the columns and then create a chart, you could create the following chart. The data is perfect for identifying bedroom amounts across a number of homes.
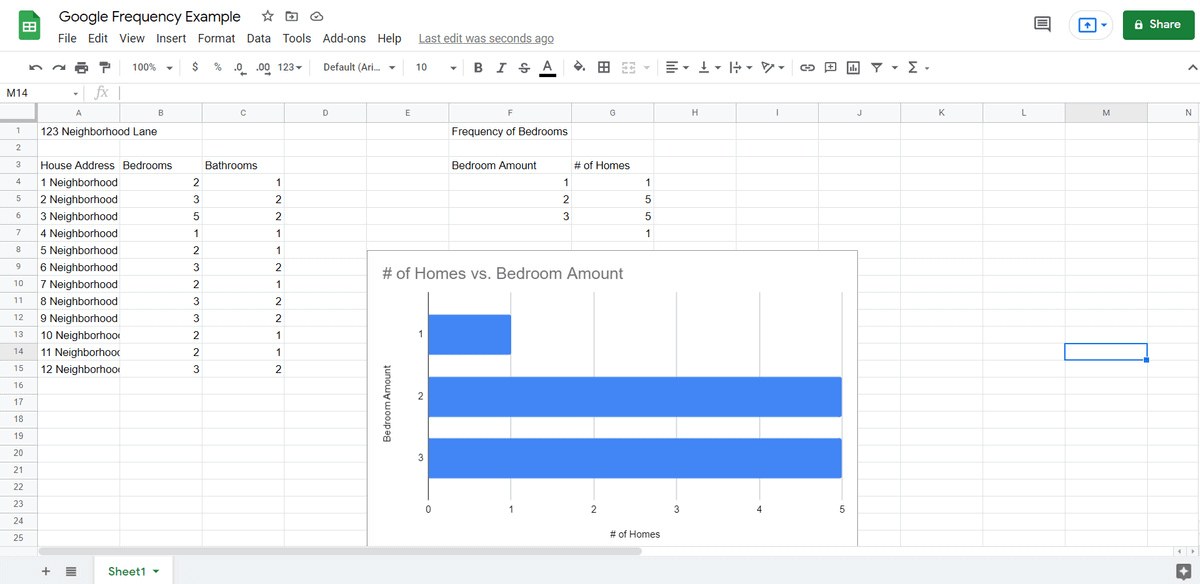
But FREQUENCY() is really only intended for distribution charts. There’s no trick to the question regarding COUNTIF — COUNTIF is almost universally preferred.
Calculating FREQUENCY() in Google Sheets
Now you know how to calculate FREQUENCY() in Google Sheets — and how to use and analyze the data later. Ironically, the “FREQUENCY” of a number is often best calculated by using COUNTIF, but there are exceptions, especially if there are a lot of values.
Google has a lot of surprising functions. So, if there’s something that you’re thinking of doing in Google Sheets, you should always look it up first — there may already be a solution.